The CAZ Strategic
Opportunities Fund
Unique Access to
Diversified Alternative Investments
The Strategy

The Overview

A Deep Dive

Founded in 2001, CAZ has grown to become one of the top 120 allocators to Private Equity worldwide.1 With over $9.9 billion in assets under management and a global network of investors, we utilize our collective purchasing power to allow for greater access to private markets.
By the Numbers
(as of 4/30/2025)
-
17.90%
Inception-to-Date Returns
(Inception 3/1/24, Class I Returns) -
$260M+
Total Fund Assets
-
$23.58
Current NAV Per Share Class I
-
17.66%
Trailing 12-Month Return
-
$9.9B+
Over $9+ Billion in total assets under management with CAZ Investments
-
24+
Years in Business
Latest Fund Update

Why Private Markets?
Since 1986, Private Equity has been one of the best performing asset classes in the U.S.
Since 1986, Private Equity* (the buying, growing and selling of privately owned businesses) has been one of the best performing asset classes in the U.S., producing over 50% higher annualized returns than the S&P 500.1
On a global level, Private Equity has substantially outperformed global stock markets over various time periods over the last 25 years.
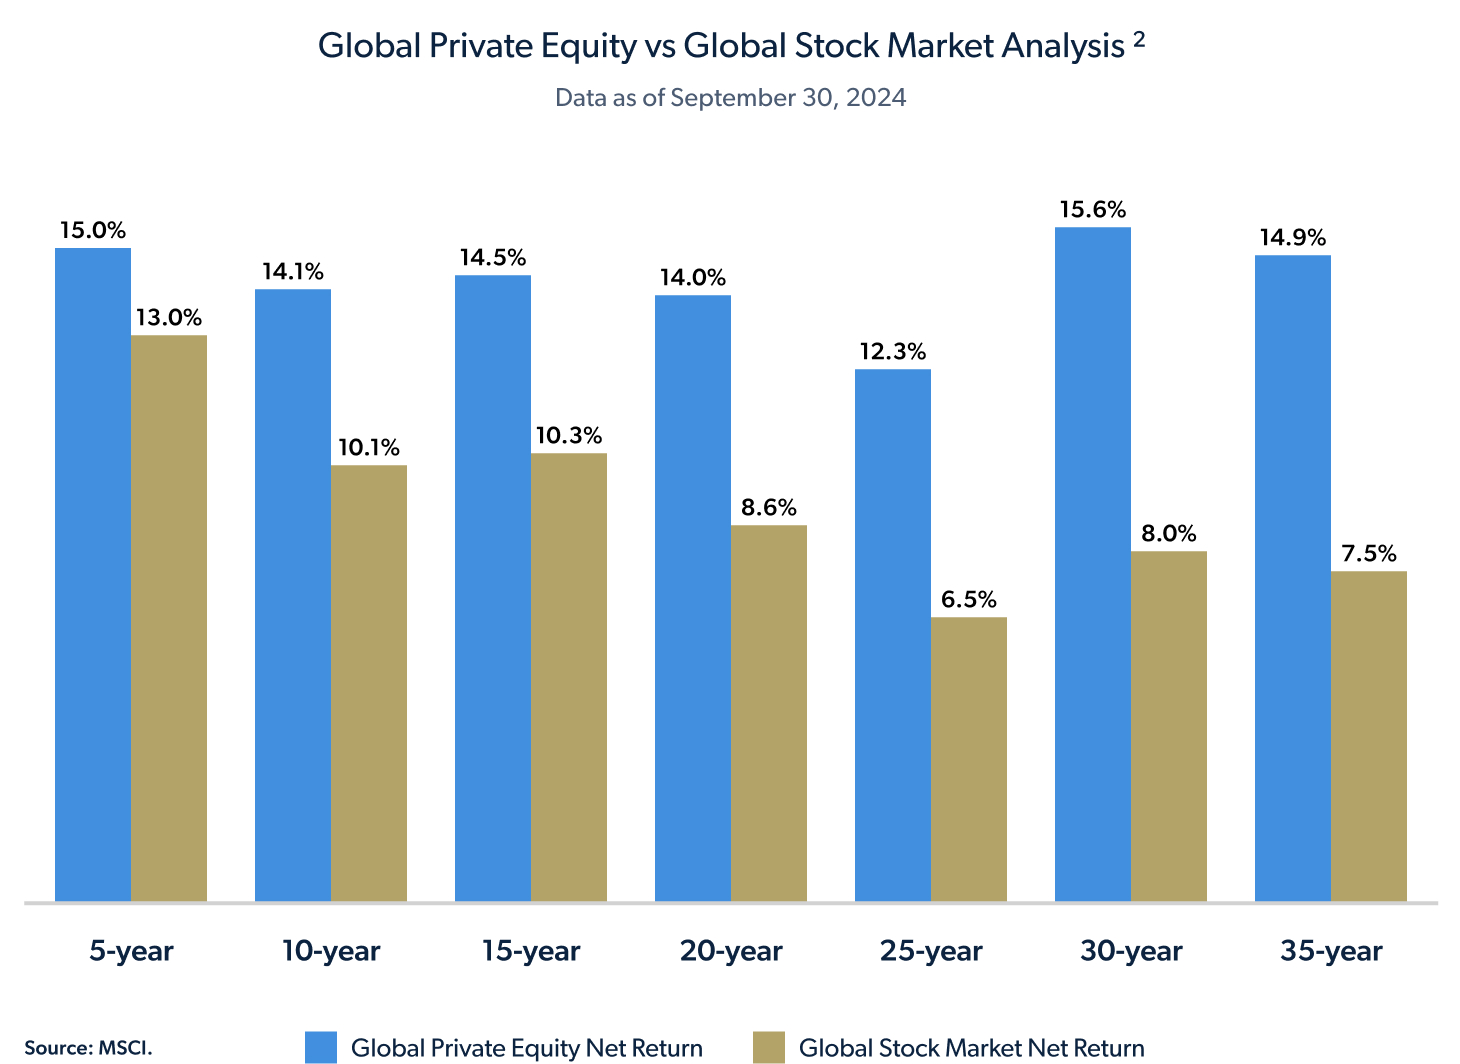
Private equity and public equity differ in several aspects. Private equity investments typically involve higher costs and expenses, including management fees and carry fees, due to the active involvement in the companies and the longer investment horizon. In contrast, public equity is generally more liquid, allowing investors to buy and sell shares on exchanges easily, whereas private equity investments are illiquid. Public equities are subject to market fluctuations and regulatory oversight, while private equity can offer more stability through active management. Furthermore, private equity can feature more significant fluctuations in principal and return, as the performance is driven by the success of individual investments, while public equity returns are more directly influenced by market conditions and can be volatile in the short term.


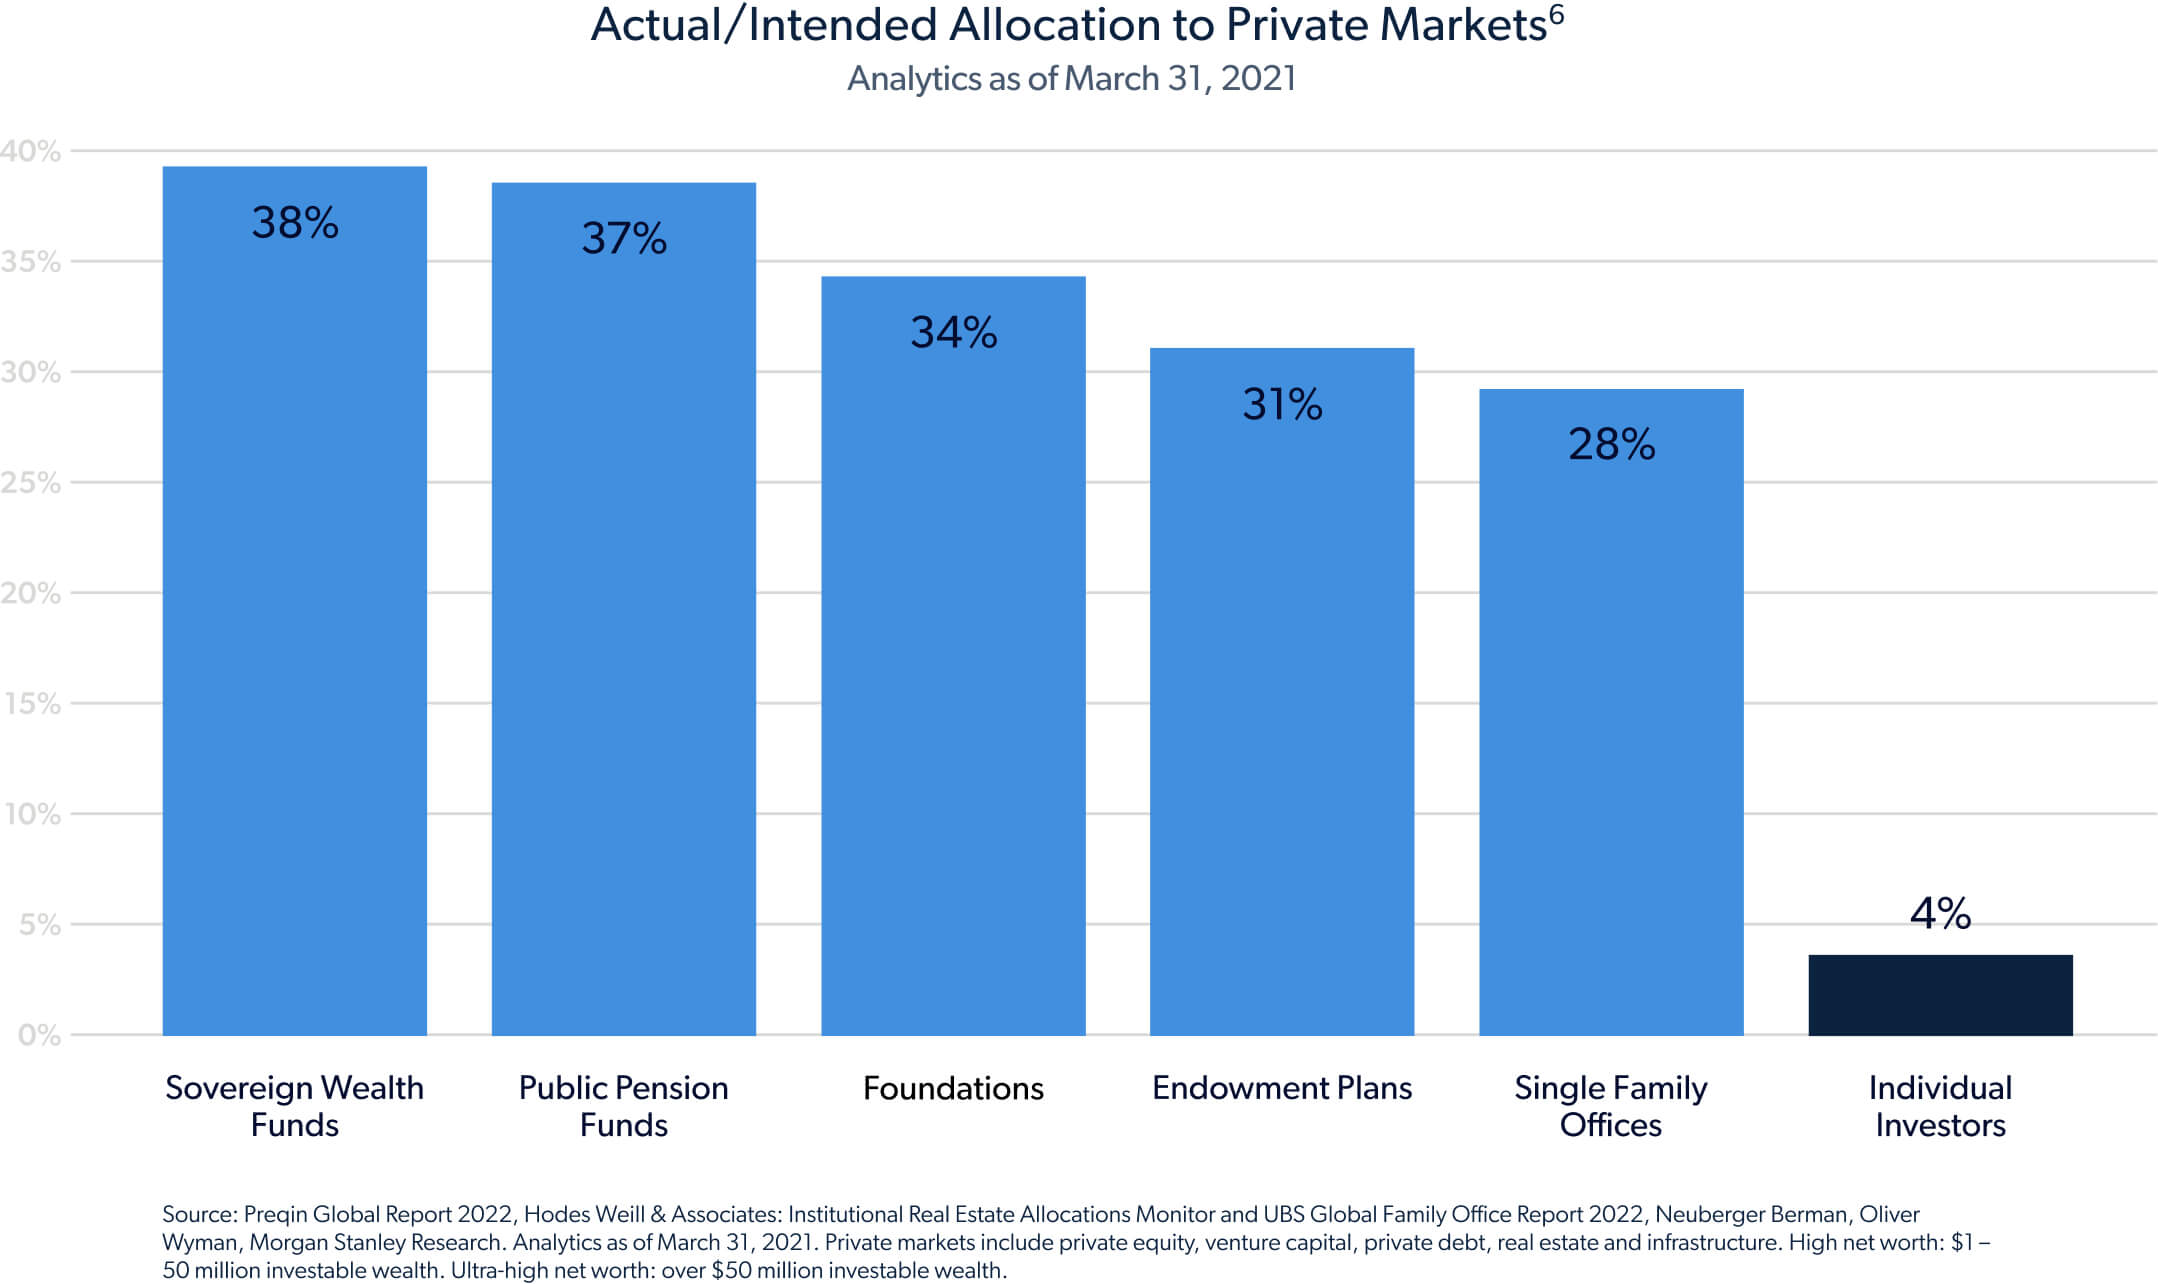
Individual Investors have minimal exposure to Alternative Investments.
FUND FACTS
The Strategic Opportunities Fund by the Numbers
The CAZ Strategic Opportunities Fund seeks to eliminate the many traditional barriers to entry by giving investors access to a broad portfolio of private investments with a low minimum and increased liquidity.
The fund seeks to comprise a minimum of 8-15 low or non correlated types of assets. This simply means that the investments are unlikely to move up or down in unison. Research done by Ray Dalio and Nobel Laureate Harry Markowitz, has shown that a portfolio with numerous uncorrelated investments can help reduce risk by as much as 80% while providing the opportunity for even greater upside potential.
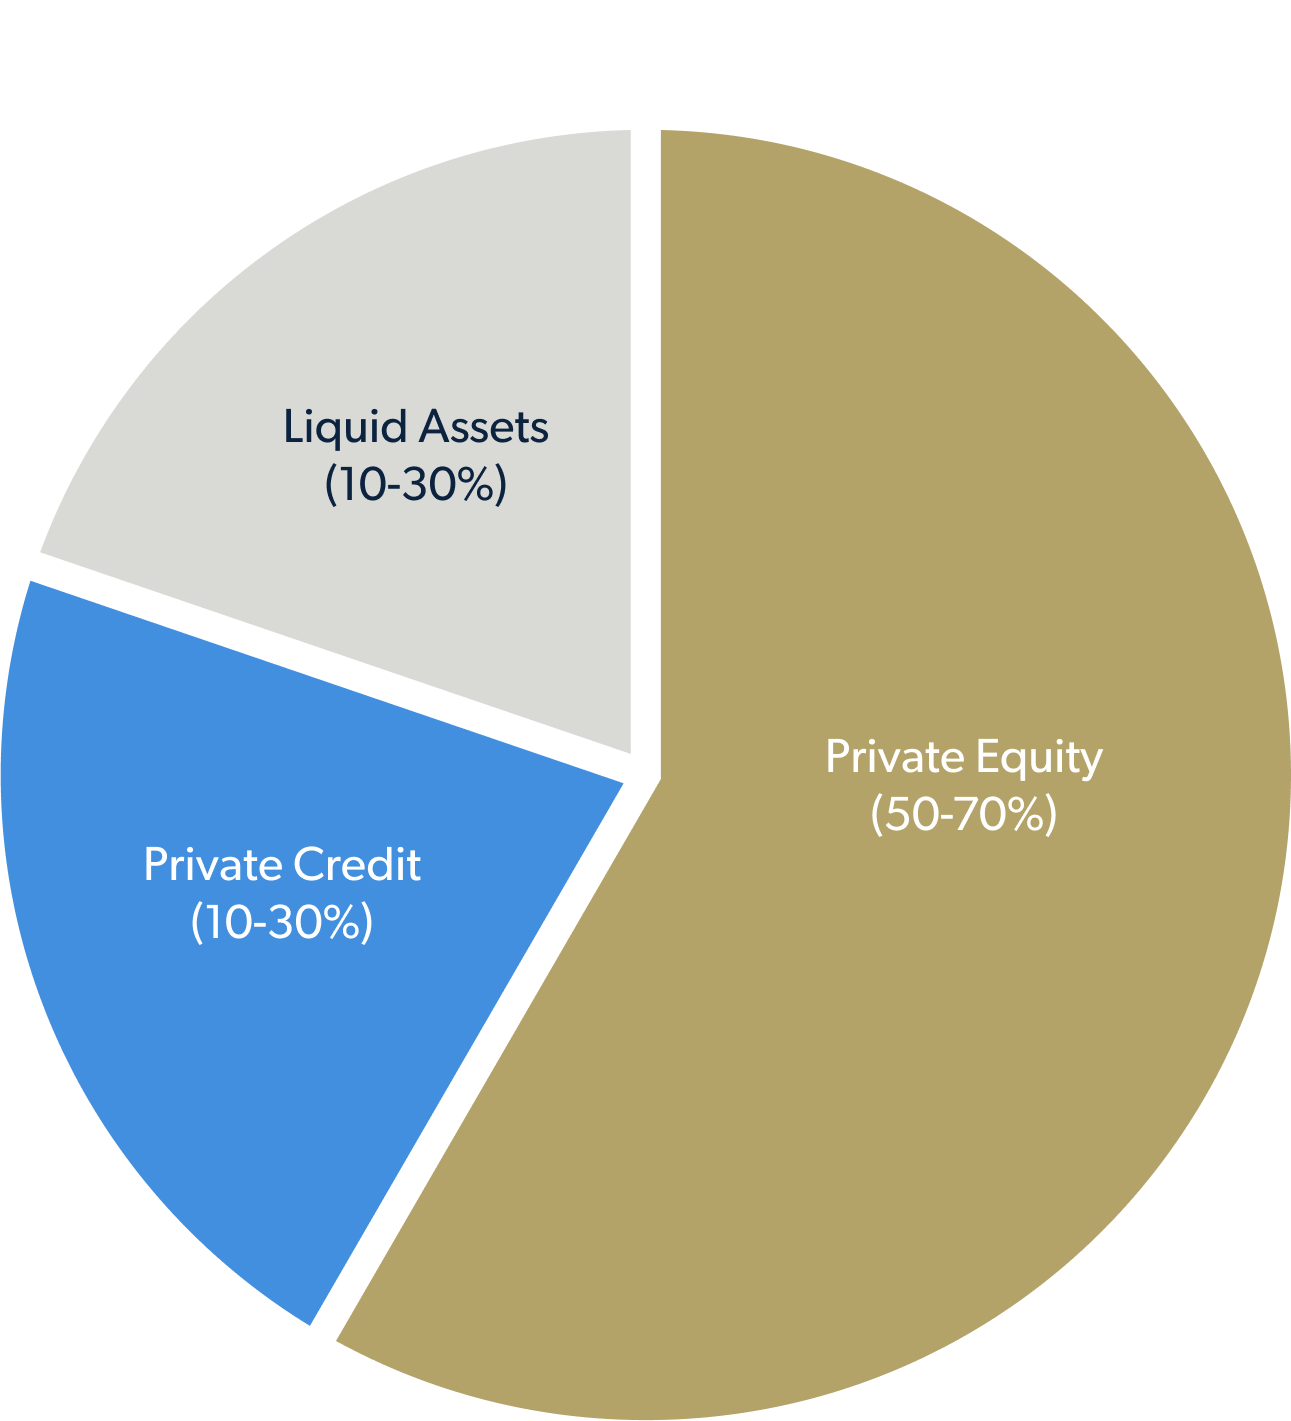
The CAZ Strategic Opportunities Fund is structured as a registered vehicle (also called a tender offer fund), that aims to provide long term returns using growth oriented private equity investments and yield generating private credit investments across various market segments, geographies, industries. The balance of the fund includes a diverse set of liquid assets and credit solutions to target greater liquidity for the fund while also providing growth potential and additional portfolio income.
Liquidity for the fund's shares will be provided only through quarterly repurchase offers in an amount up to 5% of the fund's net asset value, and there is no guarantee that an investor will be able to sell all the shares that the investor desires to sell in the repurchase offer. Additionally, repurchases will not begin until the fifth full calendar quarter after the fund has commenced operations. Furthermore, due to these restrictions, an investor should consider an investment in the fund to be of limited liquidity.
-
$25,000
Minimum Investment - No Maximums
-
Quarterly7
Liquidity
-
1099 Yearly
Simplified Tax Reporting
-
Qualified
& non-qualified accounts (IRA, Roth,
Rollover) -
Monthly
Investments Accepted
Investors should consider the investment objectives, risks, and charges and expenses of the Fund(s) before investing. The prospectus {and, if available, the summary prospectus,} contains this and other information about the Fund(s) and should be read carefully before investing. The prospectus may be obtained at (855) 886-2307 or www.cazstrategicopportunitiesfund.com.
The Fund should be considered a speculative investment and entails substantial risks,and a prospective investor should invest in the Fund only if it can sustain a complete loss of its investment.
Risk Considerations
Investing involves risk, including loss of principal. The value of the fund's shares, when redeemed, may be worth more or less than their original cost. Past performance is no guarantee of future results.
There is no guarantee that any investment strategy will achieve its objectives, generate profits or avoid losses.
There is a risk that issuers and counterparties will not make payments on securities and other investments held by the Fund, resulting in losses to the Fund.
Equity securities are subject to market, economic and business risks that may cause their prices to fluctuate.
Fixed income investments are affected by a number of risks, including fluctuation in interest rates, credit risk, and prepayment risk. In general, as prevailing interest rates rise, fixed income prices will fall. The Fund is newly formed and has no operating history.
The CAZ Strategic Opportunities Fund is distributed by Ultimus Fund Distributors, LLC, Member FINRA/SIPC.
CAZ Investments does not provide tax advice. Please consult your tax advisor before making any decisions or taking any action based on this information.
Diversification does not ensure a profit or guarantee against loss.
CAZ Investment Registered Adviser, LLC is not affiliated with "Ultimus Fund Distributors, LLC."
Sources & References
- Source: Preqin.
- Source: MSCI
- Source: www.cnn.com. Article published June 9, 2023.
- Source: Preqin, World Federation of Exchanges
- Source: Capital IQ (January 2022)
- Source: Preqin Global Report 2022, Hodes Weill & Associates: Institutional Real Estate Allocations Monitor and UBS Global Family Office Report 2022, Neuberger Berman, Oliver Wyman, Morgan Stanley Research. Analytics as of March 31, 2021. Private markets include private equity, venture capital, private debt, real estate and infrastructure. High net worth: $1 – 50 million investable wealth. Ultra-high net worth: over $50 million investable wealth. Analytics as of March 31, 2021.
- The Adviser intends to recommend quarterly repurchases of up to 5% of the Fund's outstanding shares, subject to Board of Trustees approval; 2% early repurchase fee imposed for repurchases within one year of investment. Investors may not be able to fully liquidate investments for a long period of time and should not invest money needed in the near- to medium-term.
Definitions
The Burgiss Global Private Debt Funds Index is comprised of global funds in all private debt categories including generalist, senior, mezzanine, distressed, unclassified and unknown.
The Bloomberg Global- Aggregate Index is a flagship measure of global investment grade debt from a multitude of local currency markets. This multi-currency benchmark includes treasury, government-related, corporate and securitized fixed-rate bonds from both developed and emerging market issuers.
The ICE BofA Global High Yield Index tracks the performance of USD, CAD, GBP and EUR denominated below investment grade corporate debt publicly issued in the major domestic or Eurobond markets.
A sovereign wealth fund is a state-owned investment fund comprised of money generated by the government, often derived from a country's surplus reserves. SWFs provide a benefit for a country's economy and its citizens.
Tender offer funds are continuously offered closed-end funds that are not listed on a stock exchange and seek to provide investors with liquidity by offering to repurchase a percentage of their outstanding shares.
Net Asset Value is the net value of an investment fund's assets less its liabilities, divided by the number of shares outstanding.